Analytics - Agent Availability Dashboard
The Agent Availability dashboard provides insights into when agents are online, available, paused, or actively chatting. It helps managers track staffing patterns, measure workload, and ensure coverage during key hours.
Overview
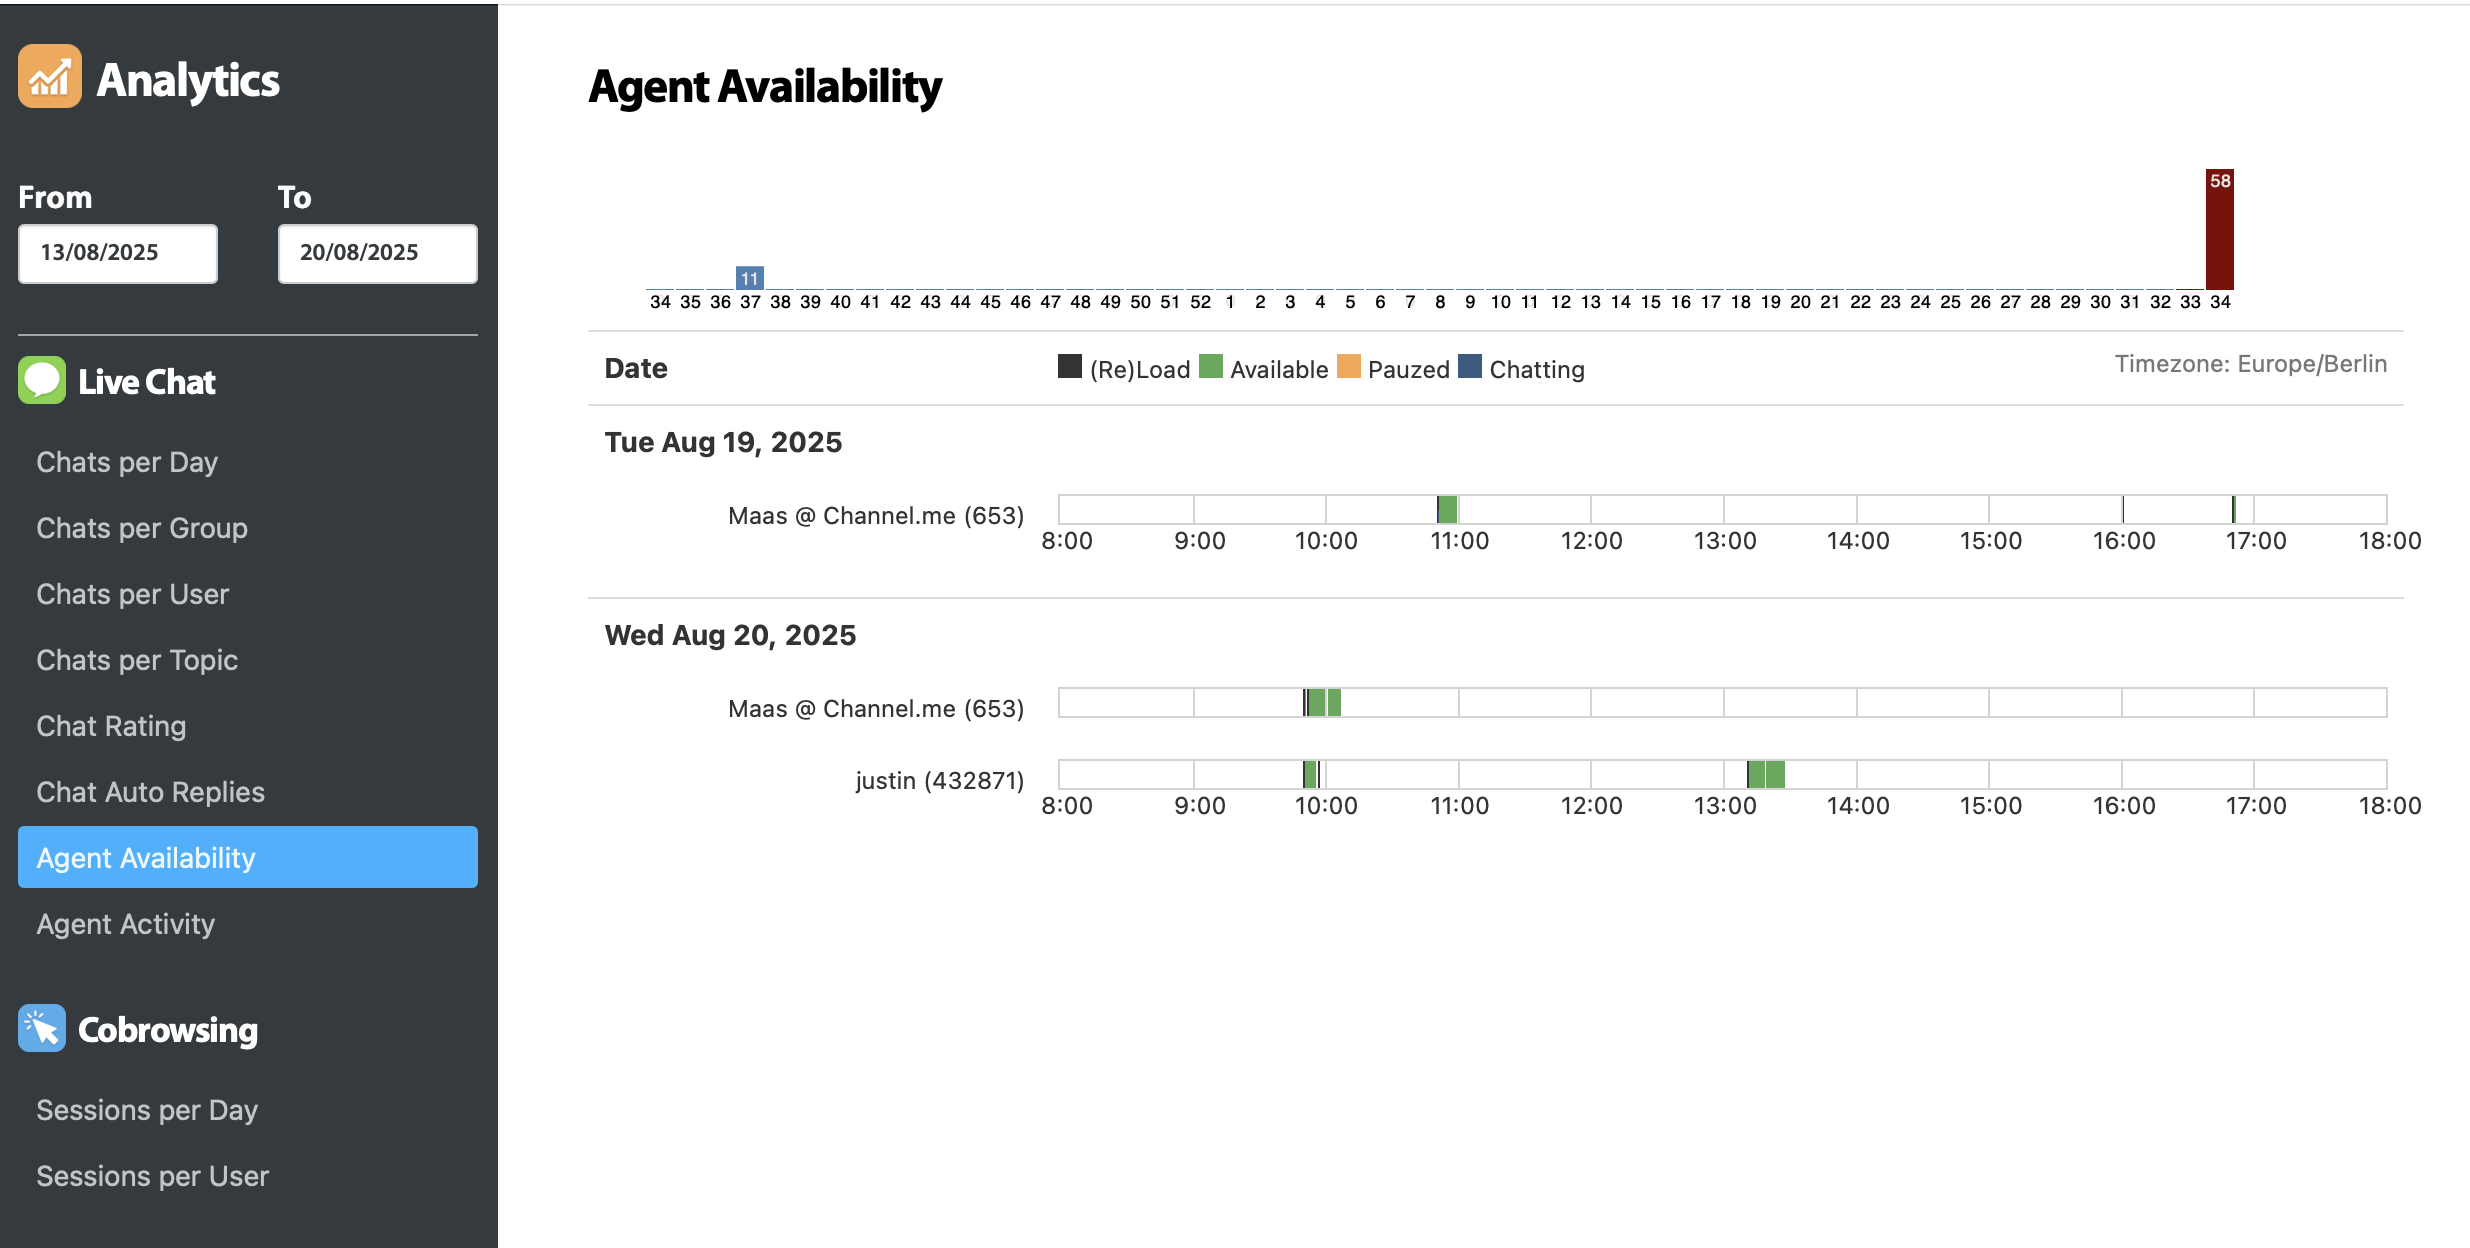
The dashboard displays a timeline view of agent activity over a selected date range. Each agent’s availability is shown in a horizontal bar chart, segmented by time of day. The timeline uses color-coded indicators to represent different states:
-
Grey (ReLoad) – The agent reloaded or refreshed the application.
-
Green (Available) – The agent was available to take new chats.
-
Orange (Paused) – The agent set their status to paused.
-
Blue (Chatting) – The agent was actively engaged in a chat session.
The timezone of the data is displayed (e.g., Europe/Berlin).
Filters and Navigation
On the left-hand panel, you can refine the displayed data:
-
Date Range: Select the period to analyze agent availability (e.g., From 13/08/2025 to 20/08/2025).
-
Live Chat Reports: Navigate to related reports, including:
-
Chats per Day
-
Chats per Group
-
Chats per User
-
Chats per Topic
-
Chat Rating
-
Chat Auto Replies
-
Agent Availability (current view)
-
Agent Activity
-
-
Cobrowsing Reports: Access cobrowsing statistics such as Sessions per Day and Sessions per User.
Features
-
Visual Timeline: Quickly see when agents were logged in, available, paused, or busy.
-
Per-Agent Breakdown: Each agent has an individual timeline for easy comparison.
-
Date Range Selection: Adjust the reporting period to focus on specific days or weeks.
-
Performance Tracking: Identify coverage gaps, peak availability times, and workload distribution.
Use Cases
-
Workforce Planning: Ensure adequate agent coverage during peak visitor hours.
-
Performance Monitoring: Track how often agents are paused vs. available.
-
Operational Insights: Review chat handling times in relation to agent availability.
-
Compliance: Validate that agents are maintaining expected availability levels.